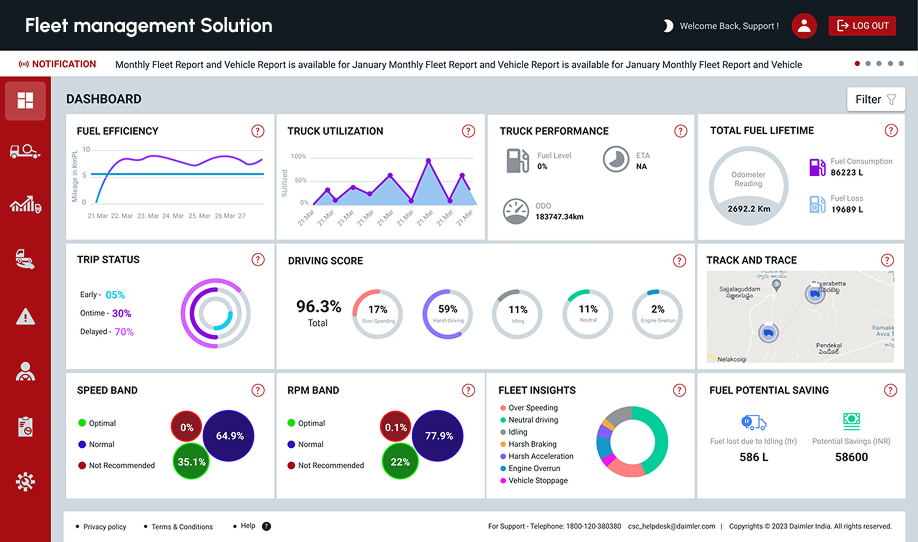
A fleet management solution that enables real-time tracking and monitoring of vehicle parameters such as speed, fuel level, driver health, and behavior. It provides features like “find my truck” to ensure transparency, enhance performance, improve productivity, and keep fleet operations ahead of the game. This application helps fleet owners in tracking vehicles real-time and monitoring vehicle parameters like vehicle speed, fuel, adblue, vehicle health, driver behavior and more. Using this application, fleet owners can optimize their fleet performance through features such as Fleet Analysis, Trip Analysis & Driving Analysis.
My Role (Senior UX Designer)
Conducted UX research and journey mapping across fleet management personas.
Designed scalable, role-based dashboards for web and mobile fleet operations.
Defined UX strategy and collaborated cross-functionally to deliver telematics solutions.
Built reusable dashboard frameworks and contributed to design system improvements.
Supported usability research, KPI tracking, and continuous product enhancement.
Leadership & Ownership
Led UX strategy
Define design system
Mentored designers
Cross-functional collaboration
Facilitated workshops
Influenced product prioritization
Challenges & Trade-offs
Data density vs usability
Mobile vs desktop priorities
Legacy system limitations
Real-time telemetry constraints
Chart Visualisation
Design Process
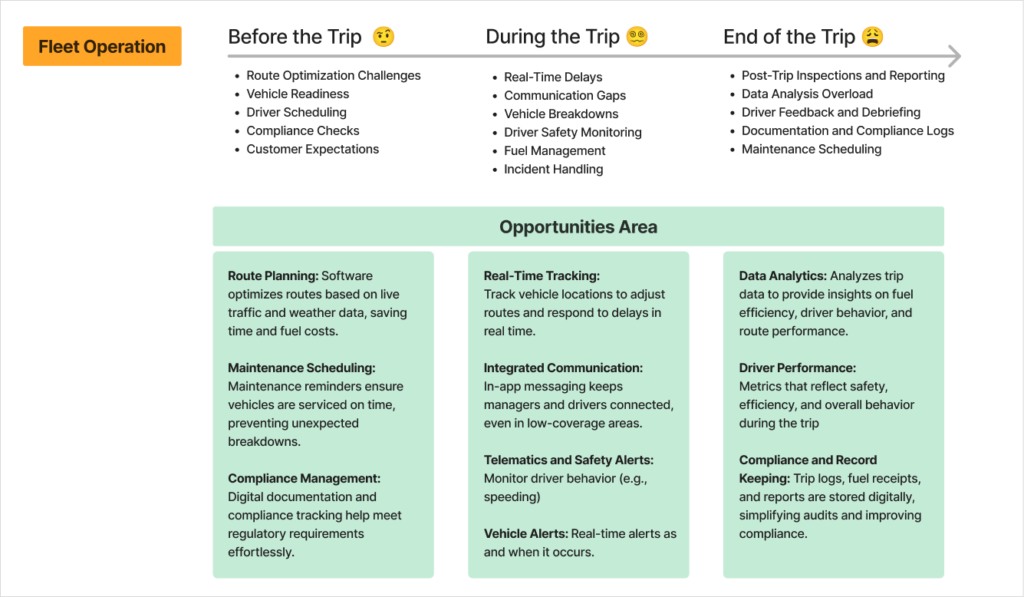
Problem Statement
Fleet owners need real-time visibility into their operations to make informed decisions, improve productivity, optimize performance, and maintain a competitive advantage. However, each stage of the fleet lifecycle presents unique challenges and opportunities that require timely insights and effective management.
Business Goal & Success Matrix
Fleet management solution that enables real-time tracking and monitoring of vehicle parameters.
Reduce operational monitoring time.
Improve vehicle utilisation and visibility.
Increase fuel efficiency and vehicle health.
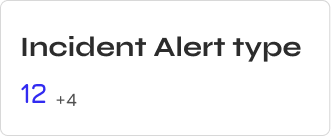
Reduce driver violation by generating Driver score based on incidents.
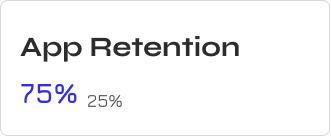
Mobile app platform improvement and adaption across users.
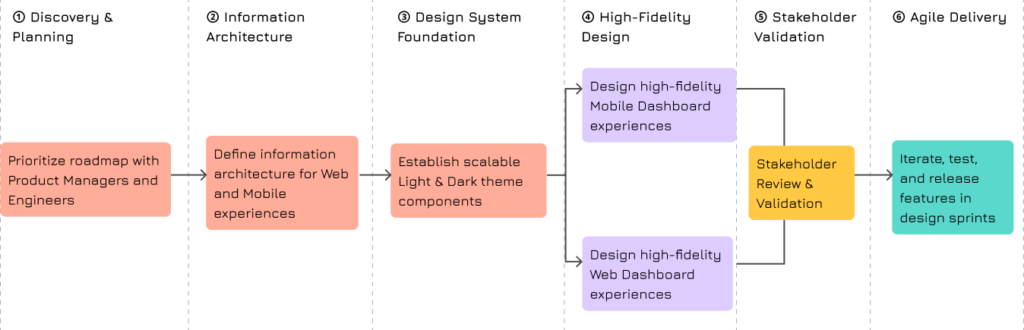
UX Strategy & Design Process
UX Research
Define and Ideate UX strategy and execution In close collaboration with fellow product managers, product owner and engineers. Keeping an Agile methodology we had defined the module and the timeline.
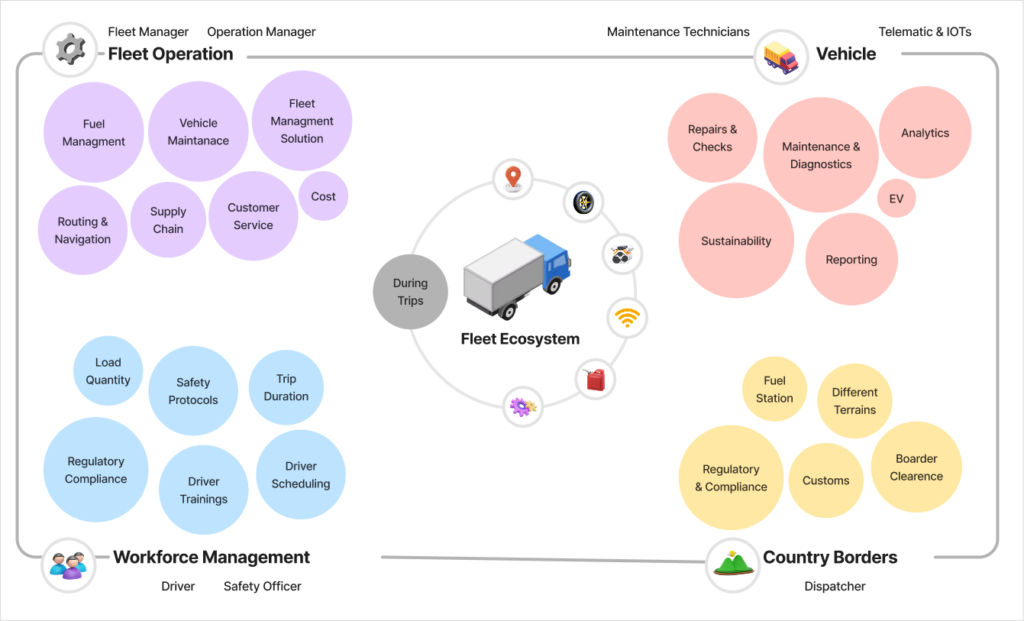
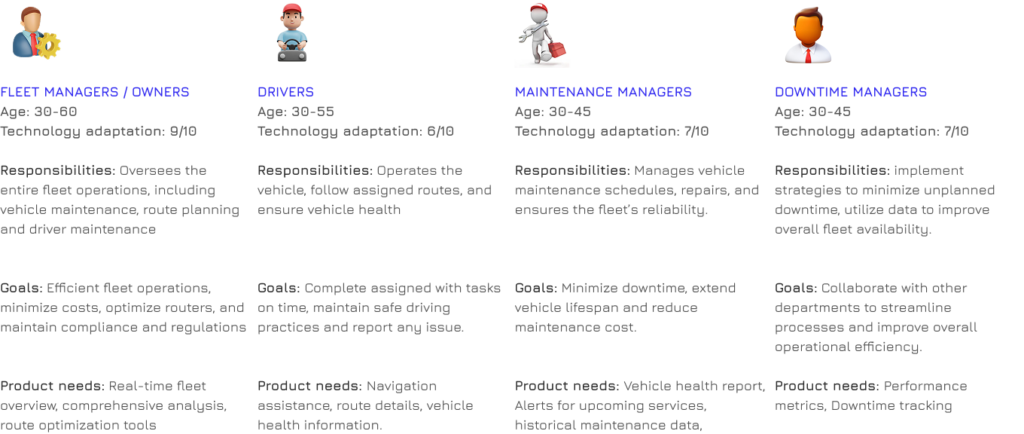
End-to-End Fleet Ecosystem and Persona Landscape
Fleet ecosystem consists of operations and multiple personas like Fleet manager, operation manager, Driver, Technicians, Safety Officers.
Personas
Solution personalised for each actor in the fleet management ecosystem:
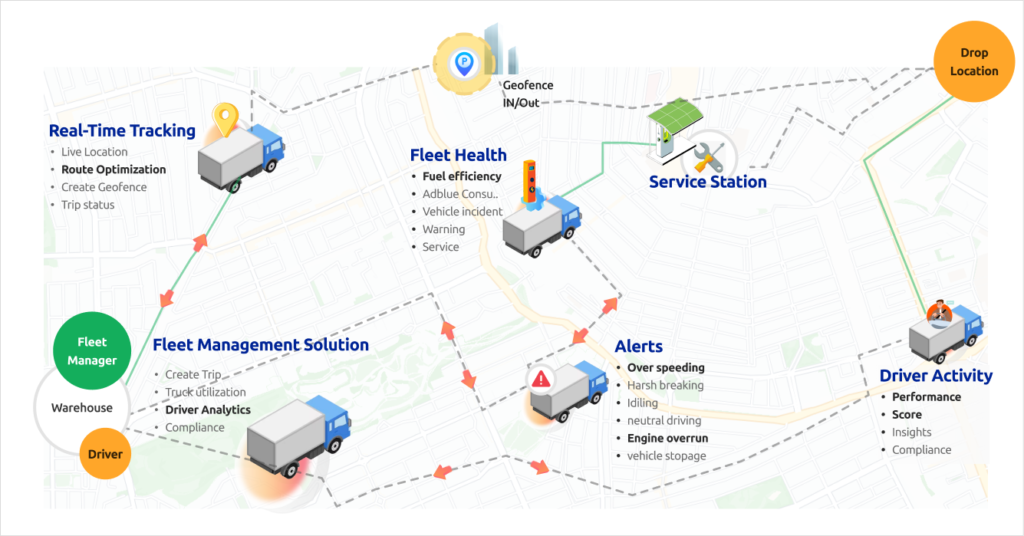
Fleet Journey Mapping
Journey map of a Truck from the system visibility of a fleet manager
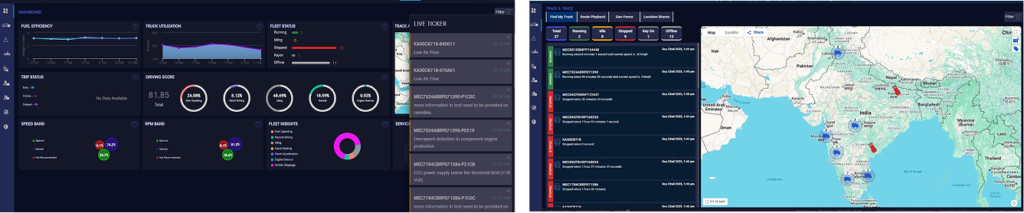
Current State UX/UI
Dark Theme – The platform initially supported only a dark theme, creating accessibility challenges and affecting KPI readability across different working environments.
Absence of a Design System – The lack of a centralized design system led to inconsistencies in components, layouts, and interaction patterns, impacting both user experience and development efficiency.
Responsiveness Issues – Several responsiveness challenges across the application resulted in inconsistent experiences on different screen sizes, particularly within data-intensive modules.
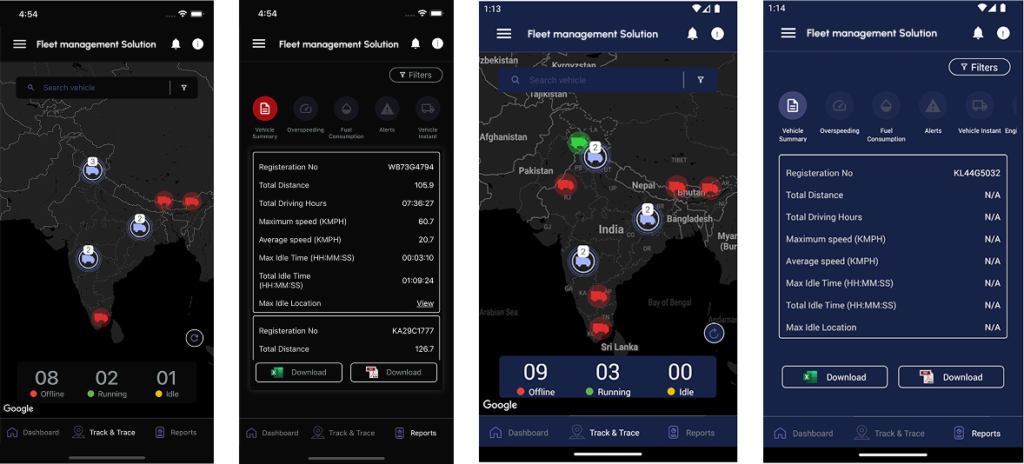
Data mismatch – Fleet Details did not always align with dashboard metrics, affecting user trust.
Missing or misaligned modules – Features like Vehicle Health and Alerts were incomplete or inconsistent with the web dashboard.
Weak information architecture – Navigation and feature discovery were not intuitive.
No light theme – The platform lacked a light mode, limiting accessibility and user preference support.
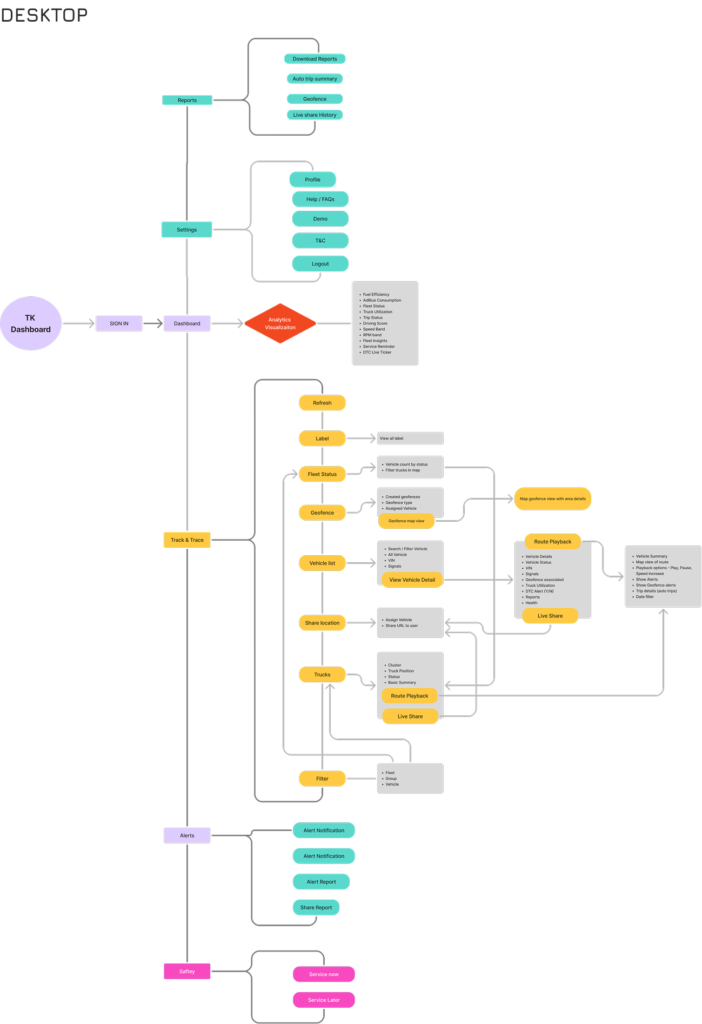
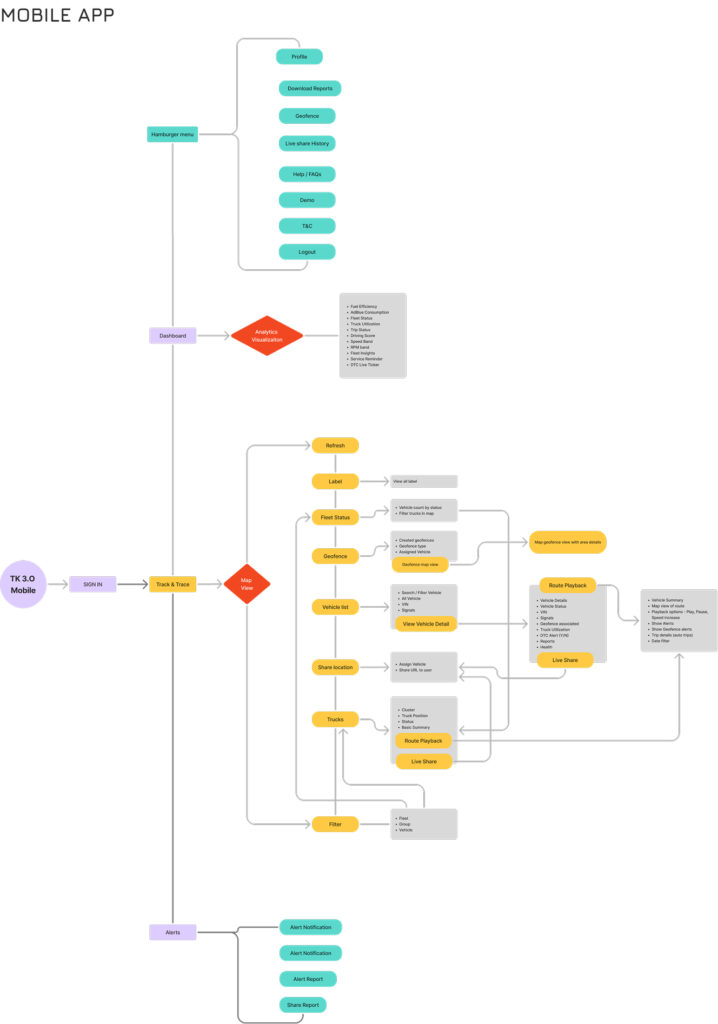
Information Architecture
App and Desktop will have different architecture but the modules and functionality need to be same throughout
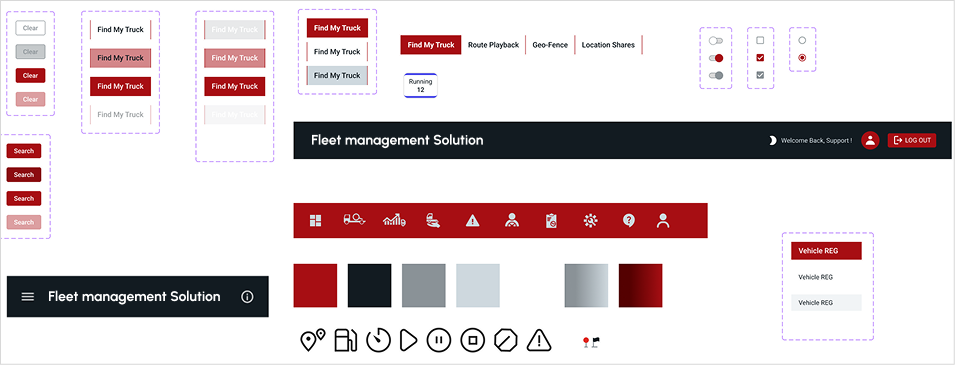
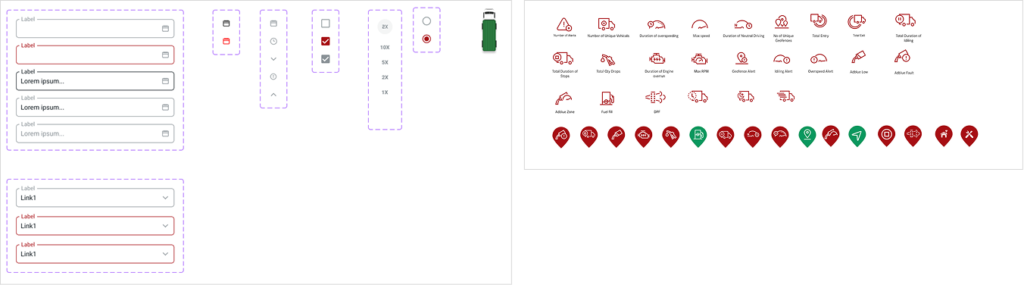
Design System Foundation
Components
Carefully crafted component to meet the design needs
Proposed High Fidelity Design
Web Dashboard Experience
Landing screen
Consolidated view of your fleet with relevant KPIs
UI Improvement
Light & Dark Theme: Introduced Light Theme to improve readability, accessibility, and data visibility.
Design System: Created a scalable design system to maintain consistency across web and mobile experiences.
Information Architecture: Defined platform-specific architectures while preserving core functionality across devices.
Responsiveness: Improved cross-device compatibility by replacing fixed pixel values with scalable REM units.
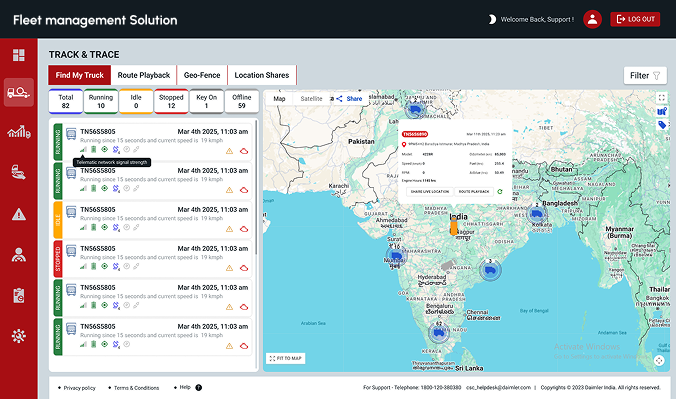
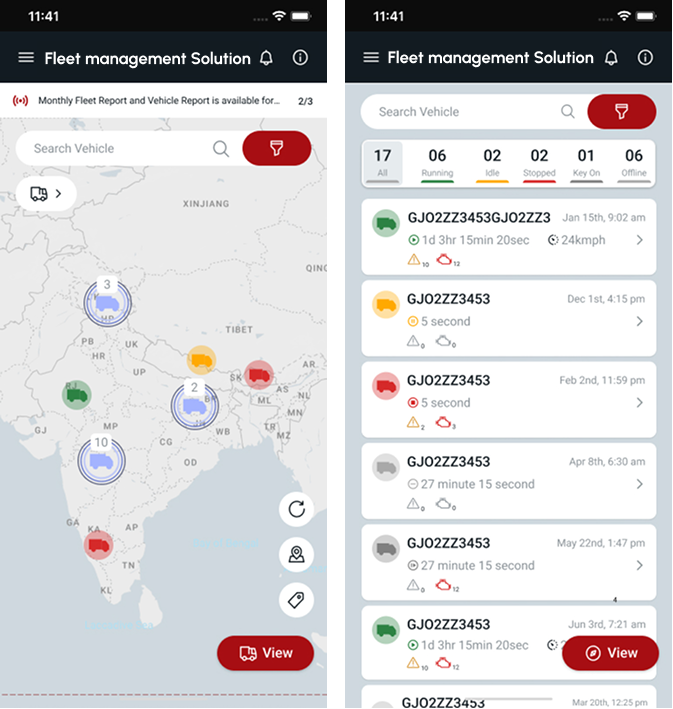
Track & Trace
Monitor the fleet realtime with live location and vehicle information
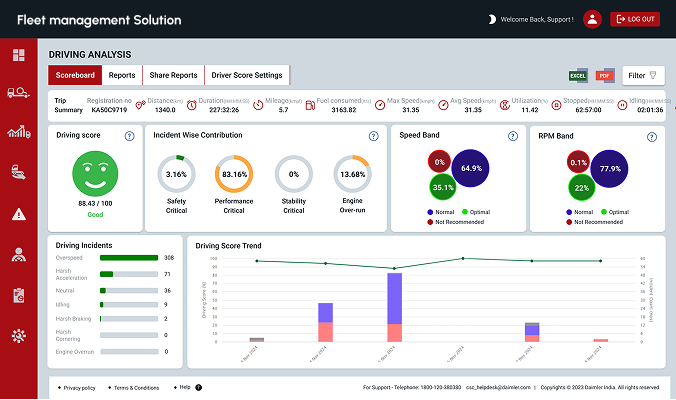
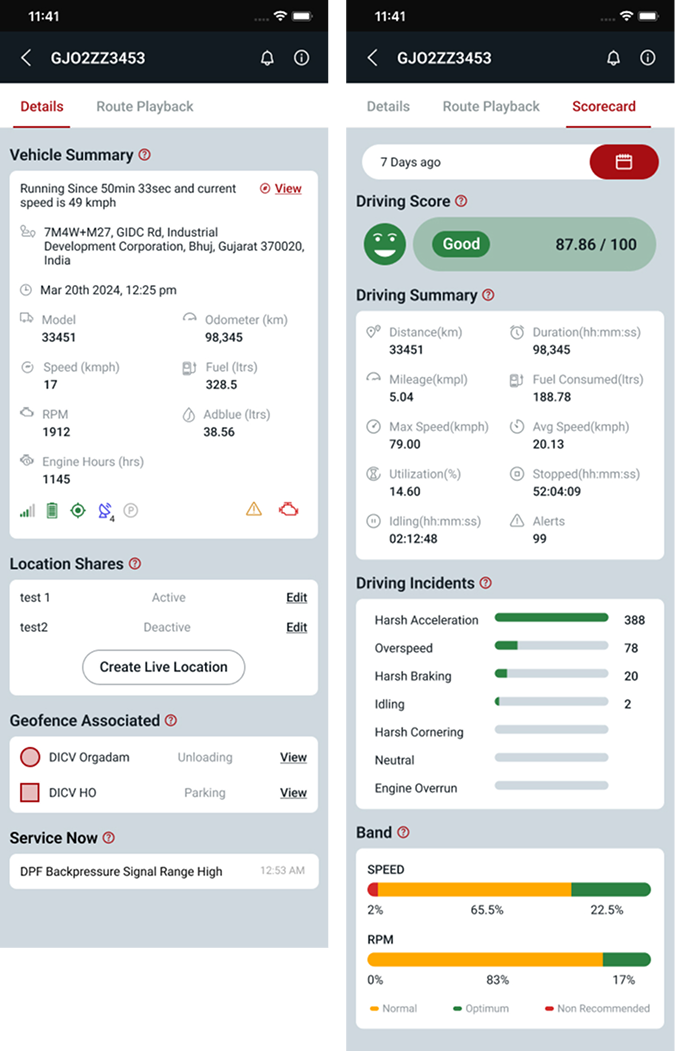
Driving Analysis
Driver behaviour across fleet/individual vehicle.
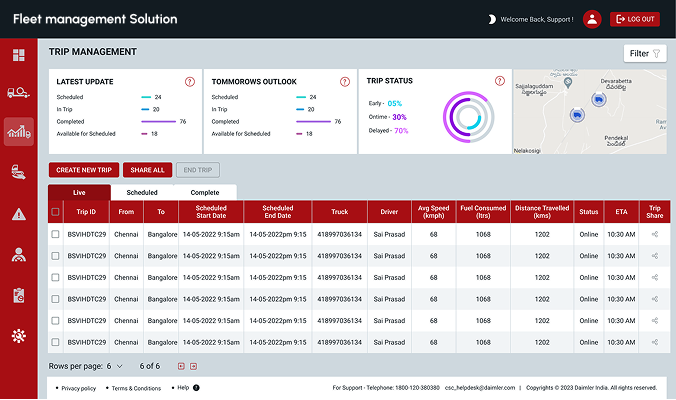
Trip Managment
Manage, create trip with driver details
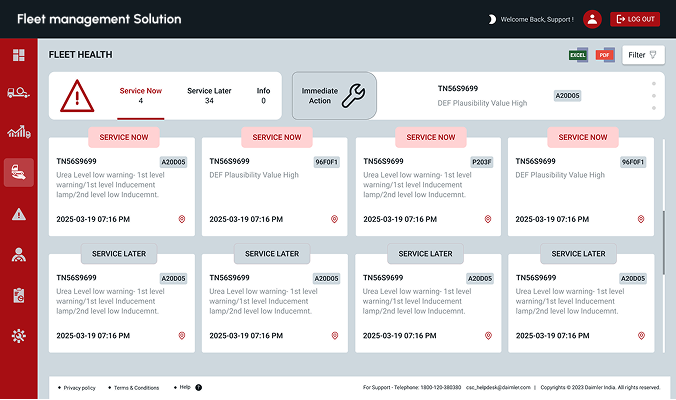
Fleet health
Real time alerts generated across the fleet. To plan servicing event based on the severity.
Mobile App
Outcome & Impact
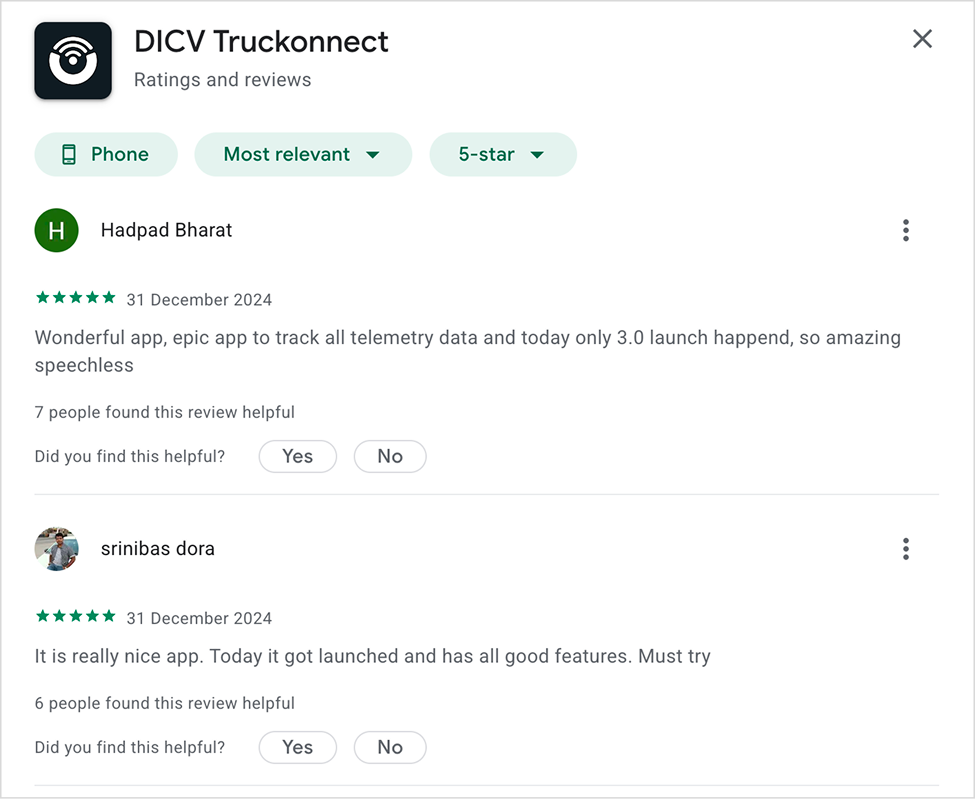
With the launch of APP 3.0 we started getting positive feedbacks from the fleet owners
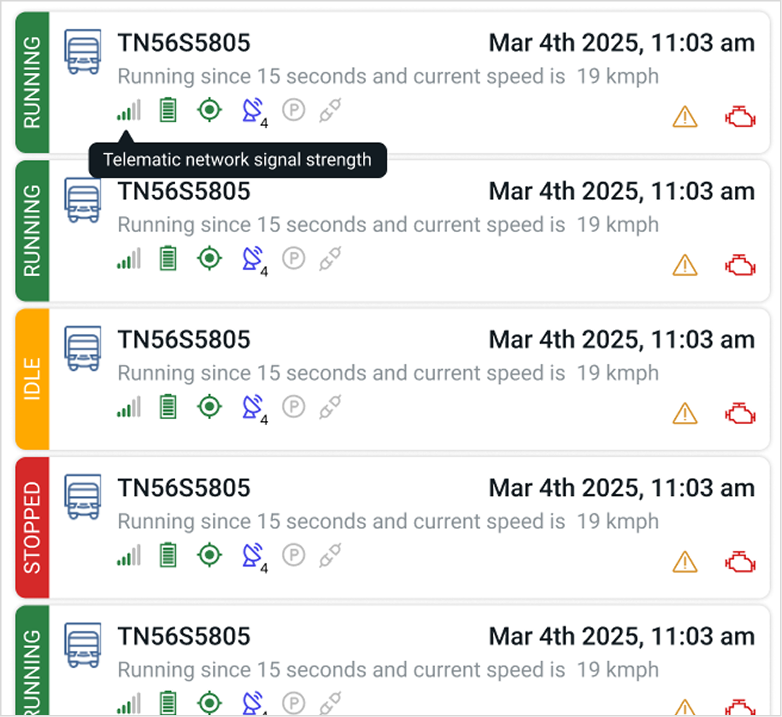
The addition of device signals provides fleet managers with greater transparency into vehicle connectivity status, helping them quickly understand why a vehicle may not be reporting data and reducing monitoring blind spots.
 500+ Users
 50,000+ Vehicle
 12 Modules
 Region – India